If you are supporting multiple business groups or organizations with employee development, you may identify how employees in a particular group compare to the average / norm of others.
Using this information may help inform wider business improvement initiatives. For example, you may need to help one division with their communication skills more than others.
To compare the scores between groups, we can look at the average scores that employees received for their performance, for each area they were assessed against.
The instructions below show how to achieve this using Excel.
Note that we don’t provide a report for this within Spidergap as benchmarks and norms are often misused.
How to export the data to Excel
We’ve created a special Excel export that makes it easy to turn the data into a “pivot table”. This will allow us to easily find the employees that need most support.
To export the data to Excel:
-
Go to the Results section
-
Click the Export tab
-
Click Download the raw data as a pivot table friendly spreadsheet (.csv)
If you wish to combine the data from multiple projects, repeat these steps for each individual project and then combine the exported data into a single spreadsheet.
How to calculate the 'norm' for each question
To calculate the average score for each question:
-
Open your Excel file
-
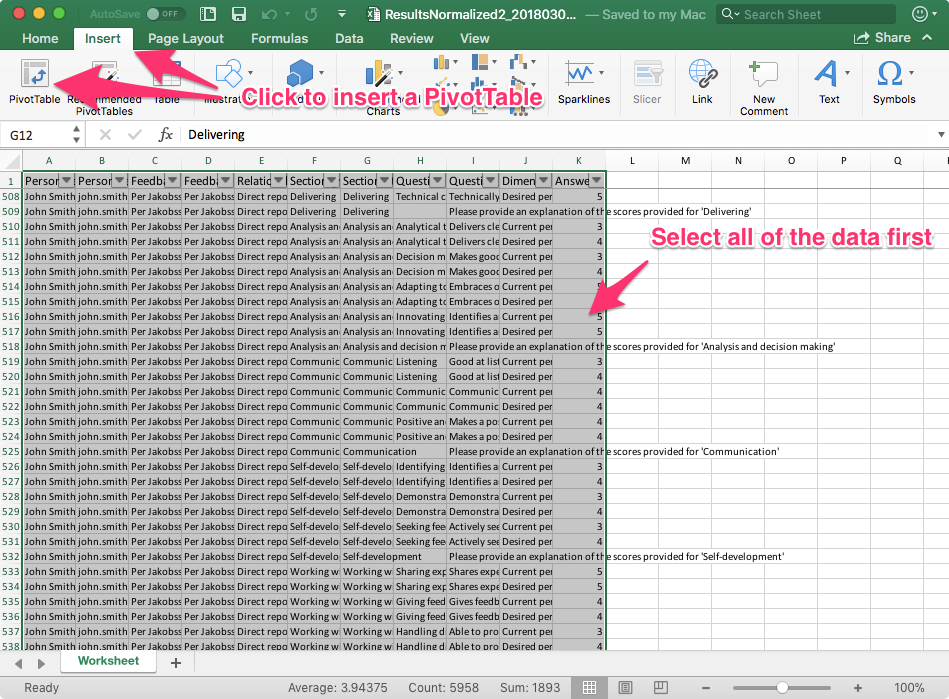
Select all of the data and insert a pivot table:
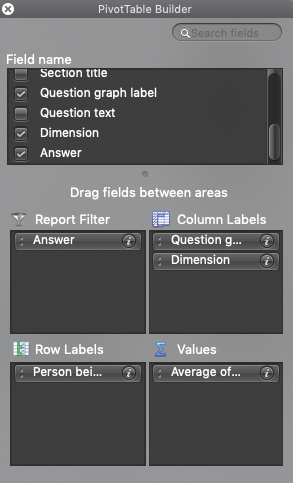
3. Set up your PivotTable with:
-
Report filter: Answer (select only the scores you want to average (i.e. 1-5)
-
Rows: Person being assessed - Name
-
Columns: Question Graph Label + Dimension
-
Values: Answer (Average of)
4. You should now see the average score each person received, for each question, for their current performance (and desired performance if this was rated).
5. You can calculate average scores of all employees for each question by adding the formula at the bottom of the question column: =Average(FIRST_CELL:LAST_CELL)
(Don't forget to replace FIRST_CELL and LAST_CELL with the cell references for the first and last cell in the column)
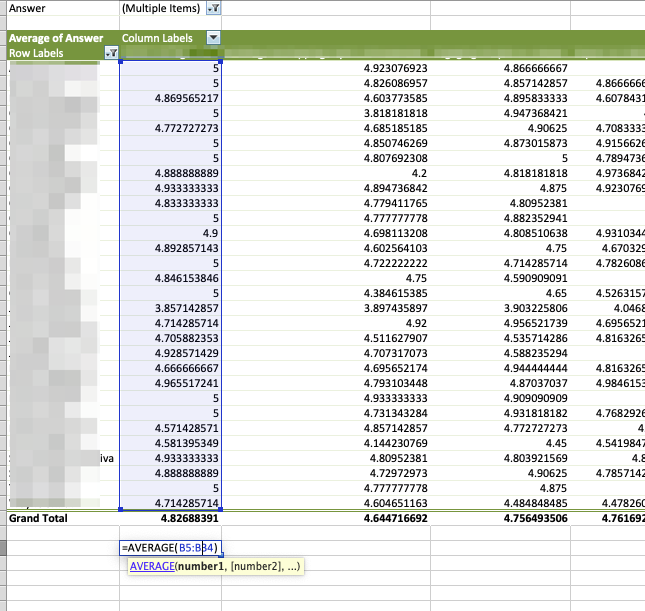
6. You can copy the formula across to the rest of the questions to see the average score for each employee, for each question.
Comparing this to other other projects or organizations
Assuming you use the same questions across multiple projects, you could repeat the steps above to calculate the averages for each project, then put is side-by-side to identify the differences.
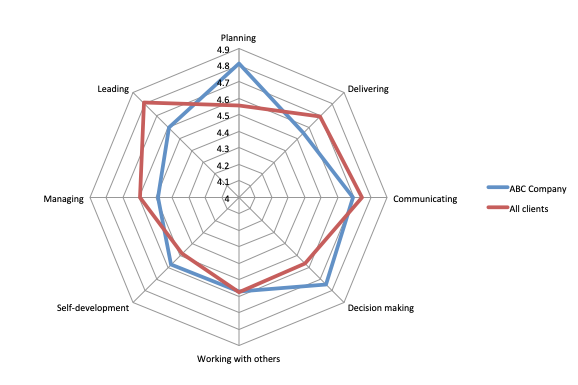
For an interesting way of showing this data:
-
Turn it into a radar / spider chart
-
Increase the minimum point on the vertical axis (to make the differences easier to see:
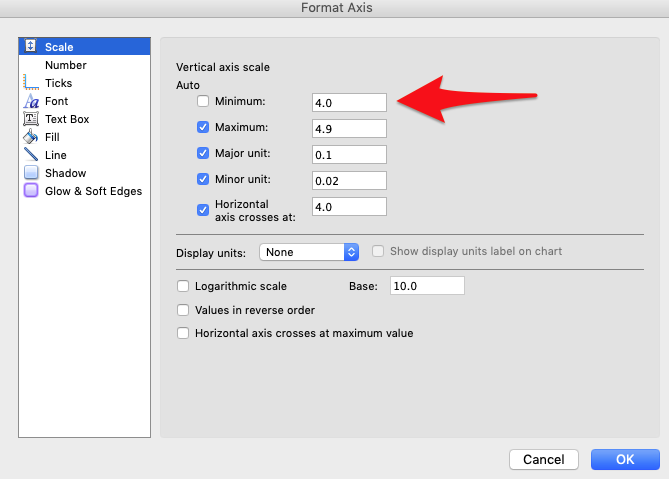
This enables you to create a diagram like this: